Are we in a recession?
Recovering from the last, brief recession in 2022, even though the economy occasionally faltered in 2022, it has remained resilient.
As of the first months of 2023, the United States is still not in a recession by conventional standards.
The four indicators of a recession are (1) business and consumer spending, (2) labor supply/demand metrics, (3) industrial production metrics, and (4) what people are earning.
Is it possible a recession is coming?
Sure. But let’s look at the numbers first.
Your average recession lasts 22 months, with six cycles from 1919 to 1945.
For the next 60 years after WWII, there are arguably 10 cycles with recessions that last an average of 10 months.
What Is a Recession?
A recession is defined as when the economy, for two consecutive quarters, has negative growth—a measurable dip in any of the four categories listed above with impact on global markets and unemployment rates. Not only that, but the housing market and overall interest rates are affected.
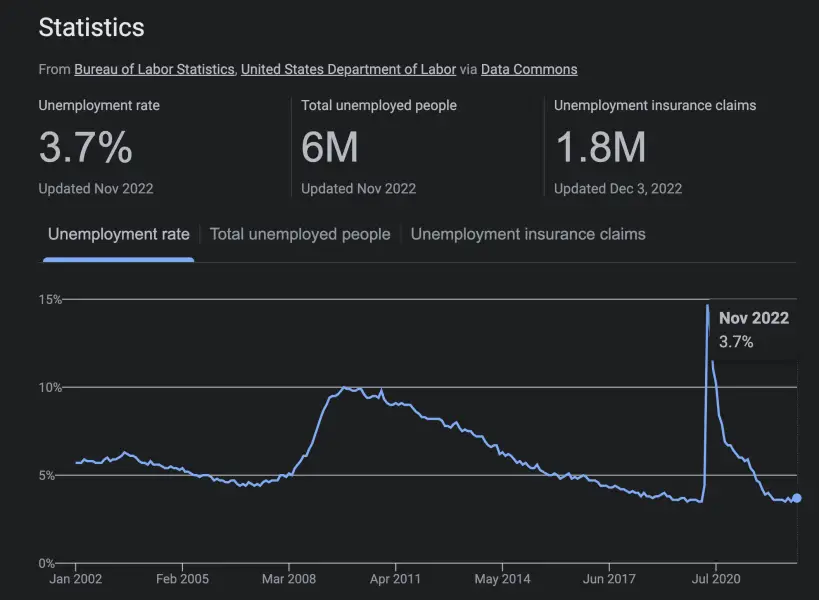
In 2022, the first six months were grim, and the U.S. technically was in a recession in the first two quarters of 2022. The economy went on to somewhat stabilize, with unemployment rates at 3.7% (November 2022 – Bureau of Labor Statistics, U.S. DOL via Data Commons).
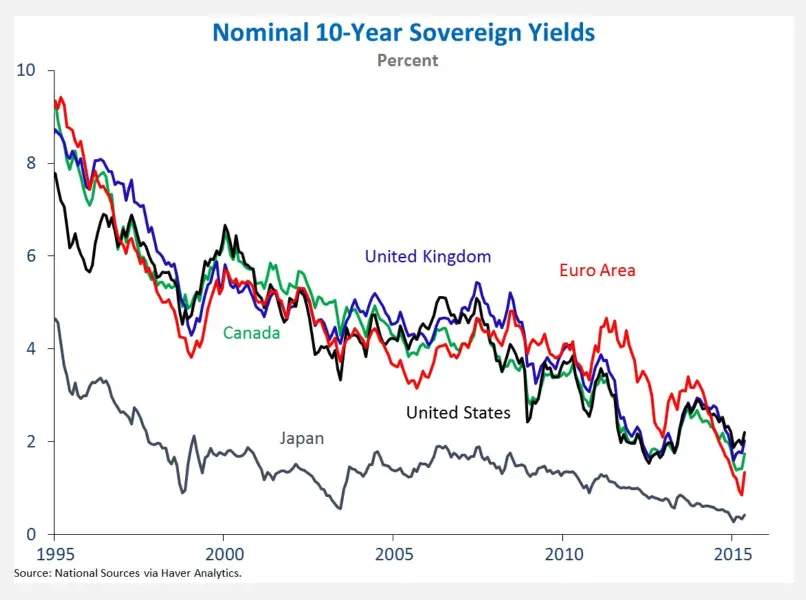
Mathematically, economists use an inverted yield curve to predict recessions based on the four indicators and what market volatility implies from a graphical point of view.
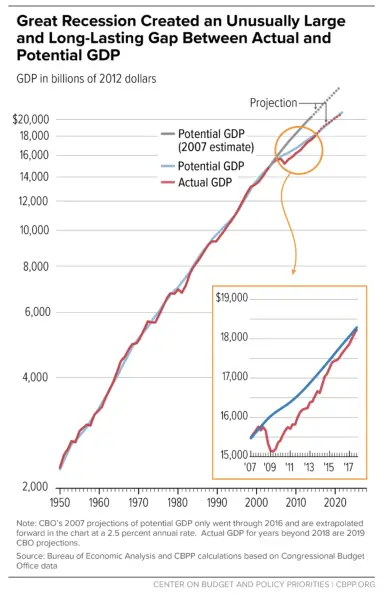
In line with U.S. Treasury rates, the 2015 Obama administration projected that the original projections are on track with current market and Treasury trends.
Fortuitous indeed, and quite predictive.
How Long Do Recessions Last?
Historically, recessions have lasted anywhere from two months to several years.
The average duration of recessions varies depending on the specific recession and the country in which it occurs. In general, recessions tend to last for several months to a couple of years. However, some recessions have lasted for much longer. For example, the Great Depression, which occurred in the 1930s, lasted for more than a decade.
It is important to note that the length of a recession is not the same as the length of an economic downturn or recessionary period.
- An economic downturn refers to a period of slower economic growth or declines in economic activity, which can last for several years.
- A recessionary period is a time frame in which a recession takes place. Many elements, such as monetary policy, economic and political changes, and economic and monetary policies, can affect the length of a recessionary phase.
Upon analysis of historical recessions from 1920 to 2022, the general trend of shorter recessions is prevalent. Due to the increased speed of liquidity and order flow, the way both individual investors and hedge funds interpret the fluctuations in the market has evolved.
In interviews with Warren Buffet—a famed value investor for the long haul—instructs new investors to check the status of their stocks monthly as opposed to daily.
In modern finance, when other investors have access to 10,000 trades per second, it does seem the length of your average recession has decreased in the last 100 years.
I think recession analysis and Warren Buffet need an update:
Modern investors buy and hold on shorter time frames.
While a recession and its indicators may denote failing economies, newer investors see a “sale” or a “dip” in what they have internalized as the ‘inherent’ value of a stock.
For example, let’s take a look at Apple stock.
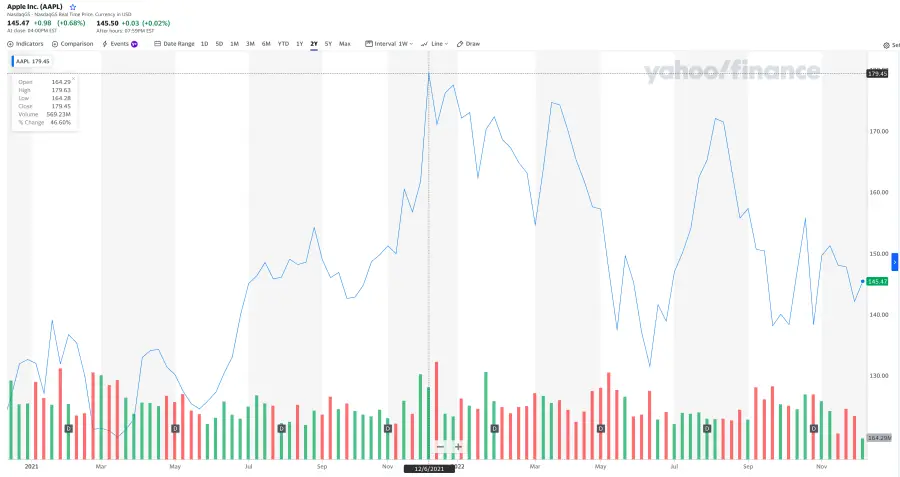
With a high of nearly $180 and a current price of $145.47 per AAPL share, the red and green bars at the bottom of the figure above denote buying and selling trends for AAPL stock from 2020 to 2022. Generally, when a stock price drops, people freak out and sell. Savvy investors tend to wait, complete their analysis, and have predetermined their entry point immediately after the “fear sales”.
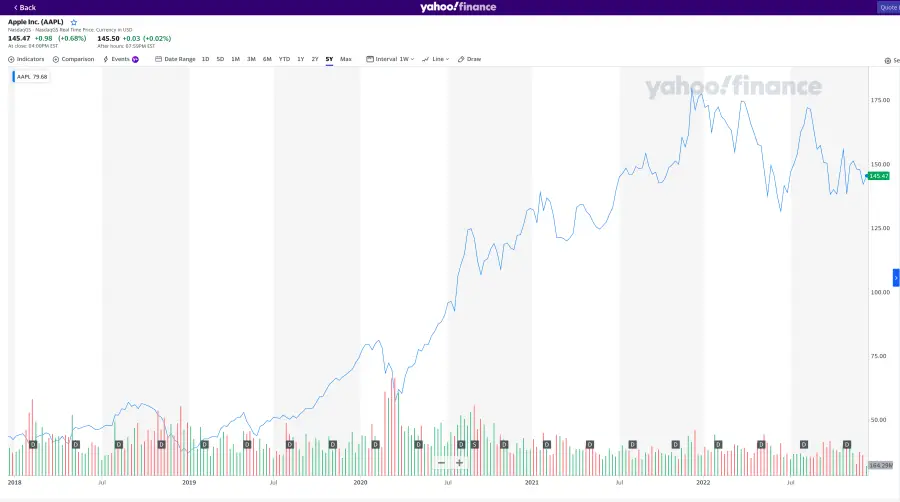
Now, upon analysis of the 5-year graph, we see extreme growth in AAPL stock over time. Each dip in the market coincides with increased purchases of AAPL stock as investors choose their entry point either after their own personal analysis or as they’re watching tickers on gamified applications. As a result, what the price was before impacts an investor’s perspective on what AAPL stock is actually worth…and what it will be in the future.
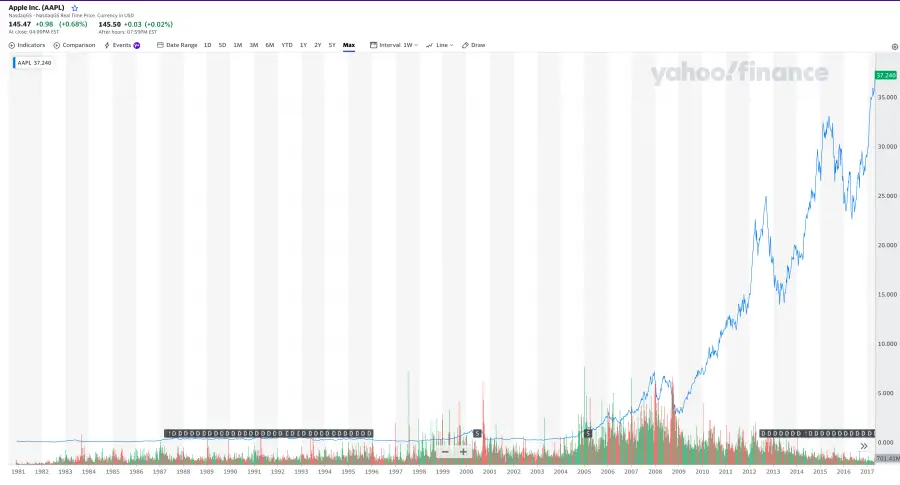
The graph above is AAPL stock since late 1980. AAPL stock was once roughly 13 cents a share. When one looks at recession graphs over time and correlates them to a company with historical performance in the S&P 500, the line becomes a fairly recognizable shape.
It goes up.
Then it goes down.
Then it goes back up because there’s new money coming back in.
Lastly, each rising line takes time. However, with each interval, the “ascent” becomes shorter (taking less time).
Periods of recession lead to sharper crashes, and faster recovery.
What’s left in the investor’s mind, is the price of the stock since the last time they checked the stock.
Or, since the last time your average investor (me or you) was spammed with information designed to influence their investment choices.
The global financial markets of 2022 are influenced by the general public’s access to widespread, varying investment information.
“Pump-and-dump” social media, Reddit, and email campaigns run amok hoping to sway the investor as they ponder their choices. Even though much of it isn’t “meant as financial or investment” advice, it’s still taken as such by some.
Consequently, with market liquidity and volatility at their highest speeds in financial history, recessions will behave differently moving forward — more than likely to be shorter than an average of 10 months.
What Causes Recessions?
Recessions are characterized by dropping GDP, significant unemployment, and a drop in investment and consumption.
Rate increases, excessive inflation, skyrocketing oil prices, escalating consumer cynicism, and decreased company investments can all contribute to an economic downturn.
- Financial crises: When there is a significant decline in the value of financial assets, such as stocks or real estate, it can lead to a decline in spending and investment.
- High levels of debt: When individuals, businesses, or governments have high levels of debt, making it difficult for them to make payments on their debts, leading to defaults and financial instability.
- Tight monetary policy: When the central bank raises interest rates to curb inflation, it can make borrowing more expensive, which can lead to a decline in investment and consumption.
- Trade imbalances: A country may experience a trade deficit and a fall in economic activity when its imports exceed its exports.
- Political instability: Wars or civil unrest can lead to a decline in investment and consumption.
- Natural disasters: Hurricanes or earthquakes, can disrupt economic activity.
What are the benefits of a recession?
One of the most important benefits of a recession is that it helps control inflation.
For example, the Federal Reserve balances its monetary policy to level out the economy in order to prevent higher inflation rates—while deftly avoiding triggering a recession.
How to Identify a Recession?
To identify a recession, there are at first, four sets of categories: unemployment, income, industrial production, and spending. These sets break down further in smaller categories of metrics used by economists to make predictions about the economy.
In an overview of recessions from 1873 to present, these four measurements provide consistent insight into the correlation of frequent “root-recession-causes”.
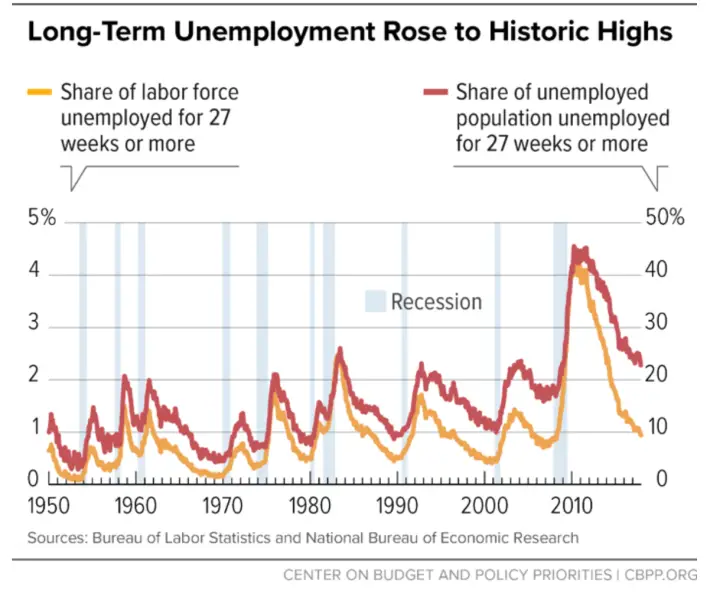
What’s Unemployment Look Like in the U.S.?
Unemployment refers to the percentage of the labor force that is actively seeking work but is unable to find a job. The unemployment rate is one of the key indicators of the health of an economy (and recessions), as it reflects the demand for labor and the availability of jobs.
There are many factors that can affect the unemployment rate, including the overall health of the economy, technological changes that disrupt the labor market, and shifts in demographics or consumer demand. Government policies, such as fiscal and monetary policy, can also affect unemployment.
Note that unemployment is a complex and multifaceted issue, and it can be influenced by a variety of economic, social, and political factors.
In the United States, the unemployment rate increased by 0.2 percentage points to 3.7 percent in October 2022, up from September’s 29-month low of 3.5 percent and slightly above market expectations of 3.6 percent.
Historically, the U.S. unemployment rate averaged to 5.74 percent from 1948 until 2022, with an all-time high of 14.70 percent in April of 2020 (amidst the Covid-19 pandemic) and a record low of 2.50 percent in May of 1953 (the Golden Age of Capitalism).
The jobless rate has been in a narrow range of 3.5 percent to 3.7 percent in 2022.
The number of unemployed persons rose by 306 thousand to 6.06 million in October 2022, while the number of employed decreased by 328 thousand to 158.6 million.
The labor force participation rate edged down to 62.2 percent from 62.3 percent.
The U.S. Bureau of Labor Statistics suggests that the labor market is already very tight, which, in turn, is “likely to contribute significantly to inflationary pressure in the world’s largest economy for some time to come”.
What is Consumer & Business Spending Look Like?
Consumer spending refers to the amount of money that households and individuals spend on goods and services. It is a key driver of economic activity, as it represents a significant portion of total demand in the economy.
Business spending refers to the amount of money that companies invest in things like research and development, plant and equipment, and marketing as businesses need to invest in order to grow and remain competitive.
Both consumer and business spending can be influenced by a variety of factors, including the overall health of the economy, the level of consumer confidence, the availability of credit, and changes in taxes or government regulations.
In general, when consumers and businesses are confident about the future, they are more likely to spend money, which can drive economic growth. Conversely, when they are uncertain or pessimistic, they may be more cautious about spending, which can lead to a slowdown in economic activity.
How is Industrial Production Measured in a Recession?
Industrial production is a measure of the output of the industrial sector of the economy, typically measured by the total value of goods and services produced by factories, mines, and utilities.
There are several ways to measure industrial production. One common method is to use data on the physical output of factories, mines, and utilities, such as the number of cars produced or the amount of electricity generated. This approach provides a direct measure of the quantity of goods and services produced, but it does not take into account changes in the prices of those goods and services.
Another approach is to use data on the value of industrial production, which takes into account changes in prices. This can be measured using data on the sales or revenue of factories, mines, and utilities, or by using data on the prices of industrial inputs and outputs. This approach provides a more comprehensive measure of the value of industrial production, but it can be more difficult to obtain and can be affected by changes in the quality of goods and services.
Regardless of the approach used, industrial production is an important economic indicator because it provides information about the level of economic activity in the industrial sector, which can have a significant impact on overall economic growth.
Measure on a monthly or quarterly basis, and compare to historical data to identify trends and changes in the level of industrial activity.
How is Income Measured for Recession Analysis?
Gross domestic product (GDP): GDP is the total value of goods and services produced within a country over a given period of time, typically a year. It is one of the most widely used measures of income, as it reflects the total economic activity within a country.
Per capita income: Per capita income is the average income earned per person in a country. It is calculated by dividing the total income earned by the total population. Per capita income is often used as a measure of the standard of living in a country, as it reflects the average income earned by individuals.
Median income: Median income is the income earned by the person in the middle of the income distribution. It is calculated by ranking all the individuals in a population by income and selecting the person in the middle. Median income is often used as a measure of income inequality, as it reflects the income earned by the “typical” person in the population.
These are just a few of the metrics that can be used to measure income in a country or financial system. The metrics breakdown further, into categories such as poverty rates and income distribution, can also be used to provide a more complete picture of income and economic well-being.
Treasury Rates and Economic Forecasts Were Fairly Accurate
Back to the Obama admistration and its successful projections of future market trends in relation to Treasury yields, in forecasts reported by the Blue Chip Economic Indicators, the blue line represents actual data. The colored lines represent the forecasts made by economists at the time. They projected what the treasury rate would be in the future.
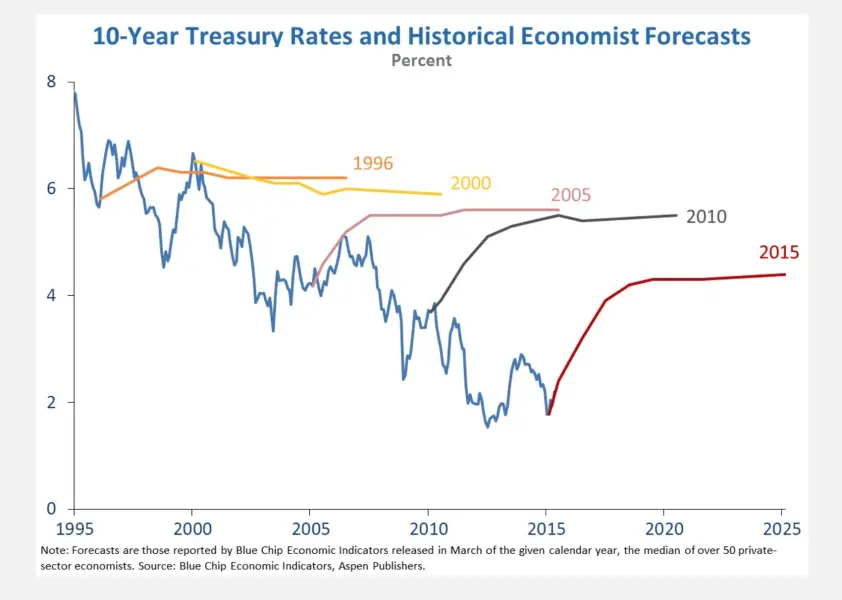
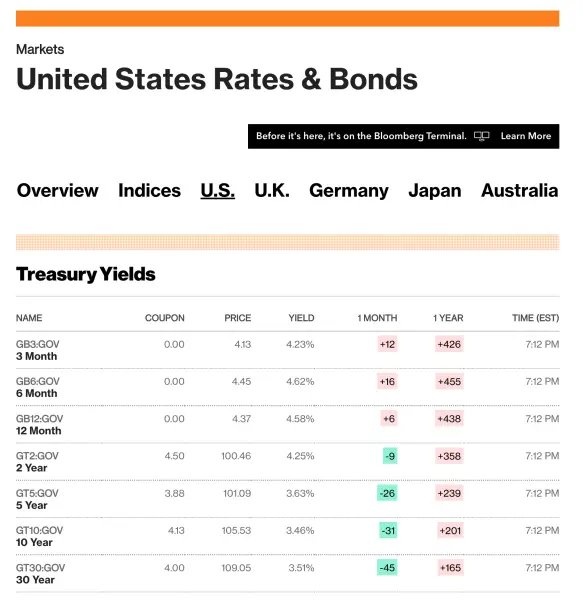
Today, the top seven treasury yields range between 3.46% and 4.62%. Looping back to the 10-Year Treasury Yield projection, the 2015 burgundy line forecasts a yield of a little over 4%.
Well within the median range.
How Do Economists Predict Recessions with The Yield Curve Inversion?
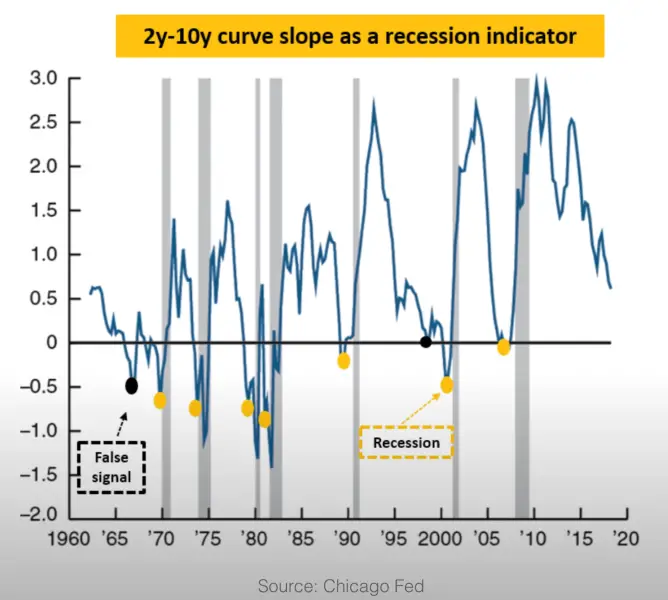
An inverted yield curve is a situation in which long-term interest rates are lower than short-term interest rates. This is the opposite of the normal relationship between interest rates, where long-term rates are typically higher than short-term rates.
An inverted yield curve can occur when investors are concerned about the future prospects of the economy and are willing to accept lower returns on their investments in exchange for the perceived safety of longer-term bonds.
This can be a sign of an impending recession, as investors are generally more willing to take on risk when they expect the economy to grow.
The yield curve is a graphical representation of the relationship between the yield (the return an investor receives on a bond) and the maturity of the bond.
When the yield curve is steep (long-term rates are higher than short-term rates), it indicates that investors are optimistic about the future and are willing to accept lower returns on shorter-term investments in exchange for the possibility of higher returns in the future.
When the yield curve is flat (long-term rates are similar to short-term rates), it indicates that investors are uncertain about the future and are willing to accept similar returns on both short-term and long-term investments.
When the yield curve is inverted (long-term rates are lower than short-term rates), it indicates that investors are concerned about the future and are willing to accept lower returns on longer-term investments in exchange for the perceived safety of those investments.
Top Industries & Businesses That Historically Performed Well in Most Recessions
Historically, industries consistently prove to be recession-proof.
Industries are run by people for people.
Industries involve people — certain pschological, historical, and inherently genetic human factors are bound to apply.
Collated here is a break down of most “recession-proof” industries as reported by the sources below.
| Rank | Bank of America’s List | CNBC‘s List | Tony Robbins‘s List | Forbes‘s List | Investopedia‘s List |
| #1 | Candy | Healthcare | Groceries | Necessity retailers | Accountants |
| #2 | Repairs | Government | Healthcare | Shipping & goods transportation | Healthcare Providers |
| #3 | Childcare | Computers & Information Technology | Candy | Healthcare | Repair & Maintenance |
| #4 | Niche food stores | Education | Beer, Wine & Liquor | Maintenance Stores (Not Builders) | |
| #5 | Freelance & temp work | Discount Retailers | Home Maintenance Stores | ||
| #6 | Static businesses | Children’s Goods | Home Staging Experts | ||
| #7 | Health & Fitness | Pet Industry | Rental Agents & Property Management Companies | ||
| #8 | “Sin” industries | Financial Advisors & Accountants | Grocery Stores | ||
| #9 | Cybersecurity & Tech Support | Bargain & Discount Stores | |||
| #10 | Repairs |
The Future.
Projections support a substantial ROI on investment in healthcare and collaborative autodidactive (self-learning) platforms in developing countries where the local consumption metrics (GDP categories) are especially historically on the rise.
SE Asia, Asia, Eastern Europe, sections of Africa, and Central and Southern America were a particular focus in the analysis.
This is not meant as financial advice, but an overview and analysis of historic recession data with the intent to forecast.